The initial version of the Sales Overview report was released in June. Since then we have received some valuable feedback and some of it is now incorporated in the updated Sales Overview report:
The first page of the report report now gives you:
- Performance figures for today, yesterday, last 7 days, last 30 days and last 365 days compared to previous periods
- An option to view the data per website
- A new larger chart showing your performance data for the last 30 days (Daily), 26 weeks (Weekly) or 12 months (Monthly)
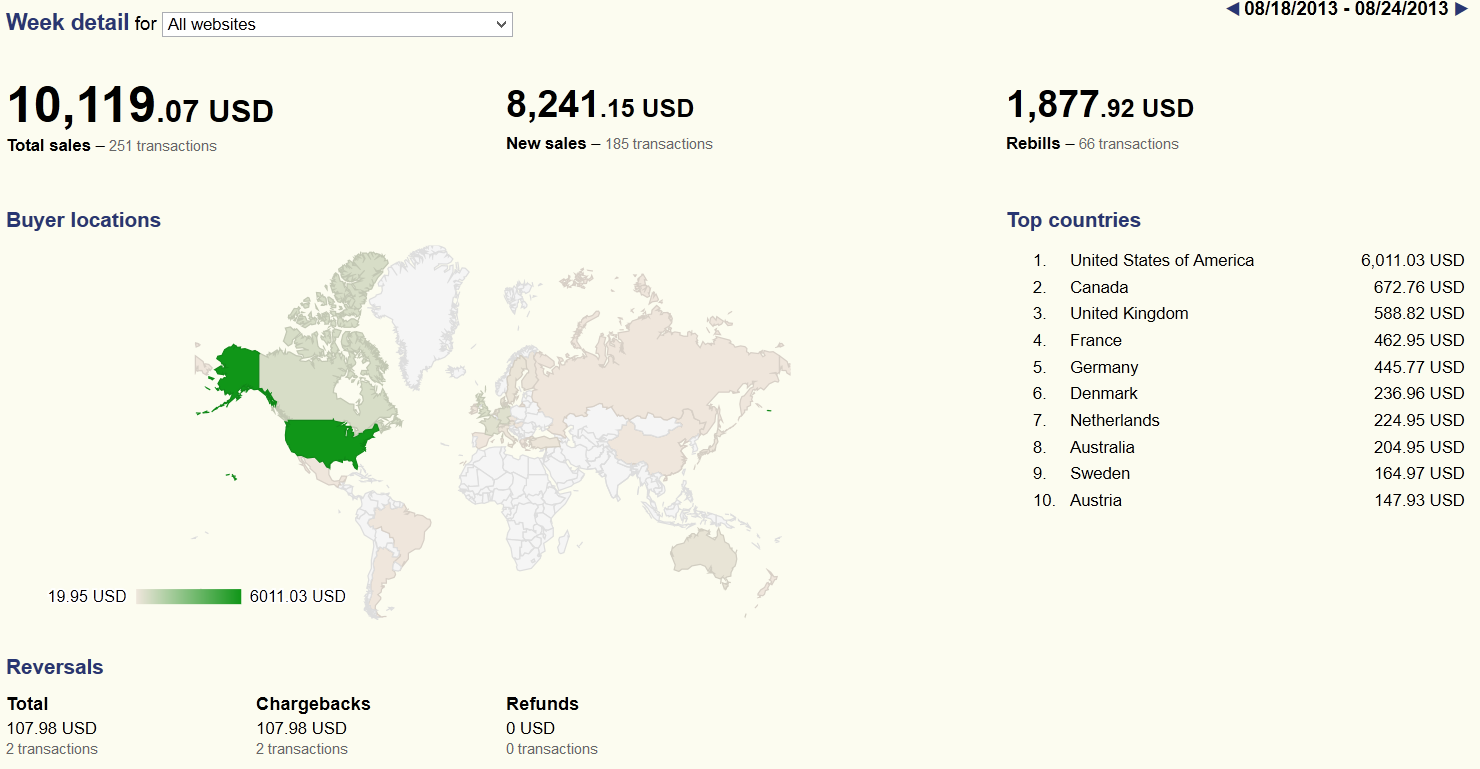
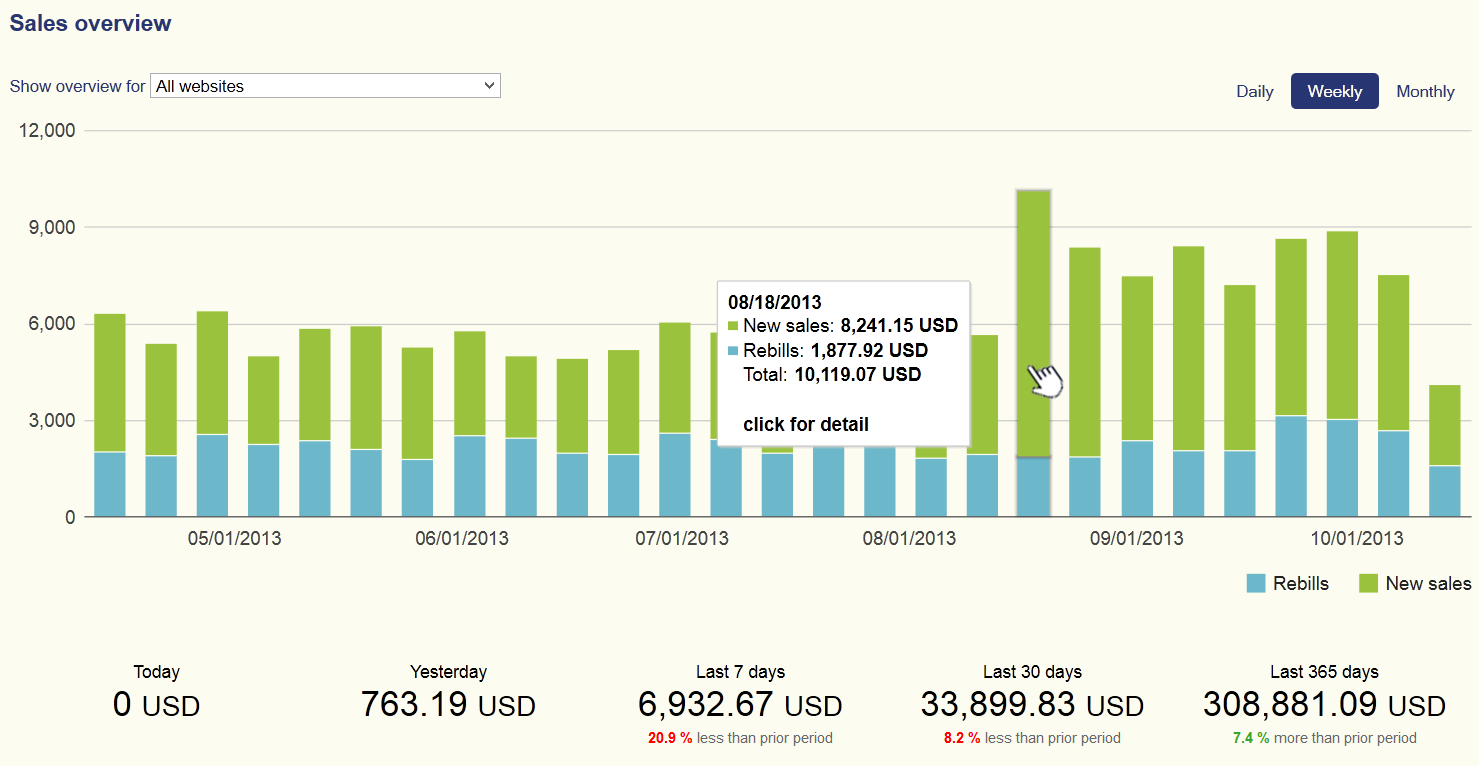 By clicking on the chart you can also access the Detail page showing a variety of additional information for the selected period such as:
- Performance figures and the number of transactions – the Total sales, New sales and Rebills
- Reversals section showing the figures for Refunds and Chargebacks
The middle section of the Detail page now shows the “Top 10 countries” from which your buyers came and a “heat map” showing these countries.
Our vision is to use the middle area for various other reports such as: a list of “Top performing websites” , “Sale breakdown per sale currency”. Are there other reports you want to see here ? Let us know !