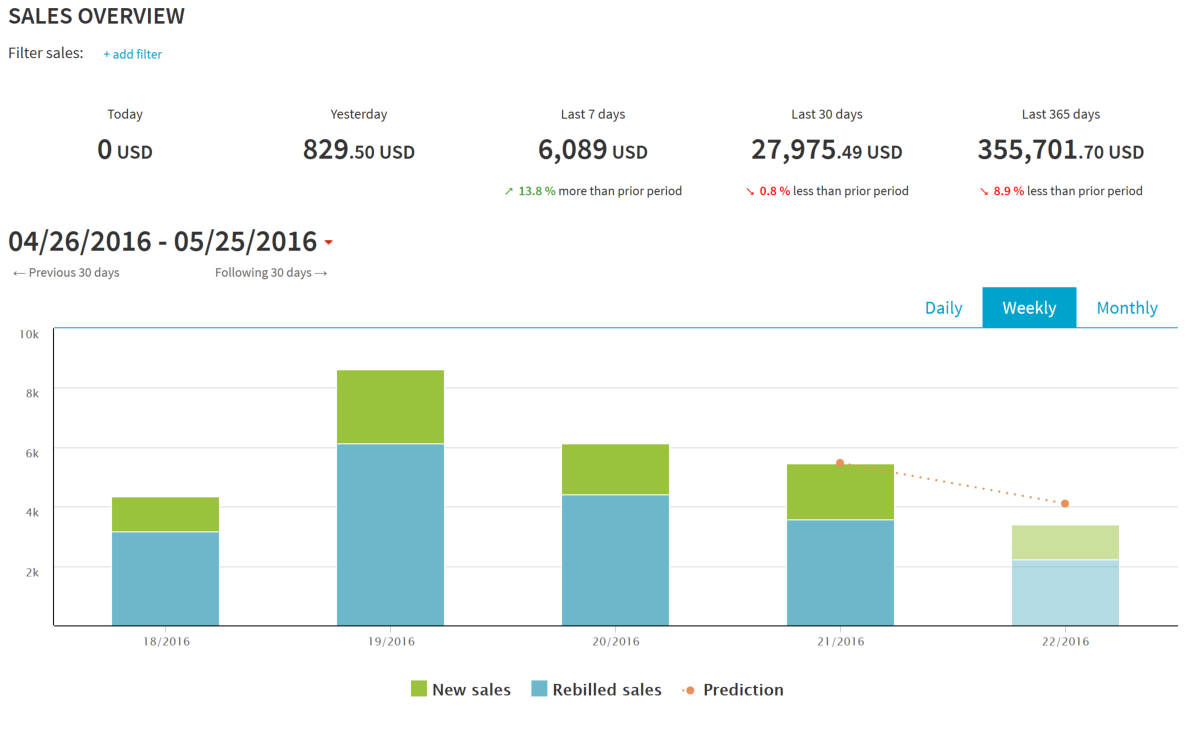
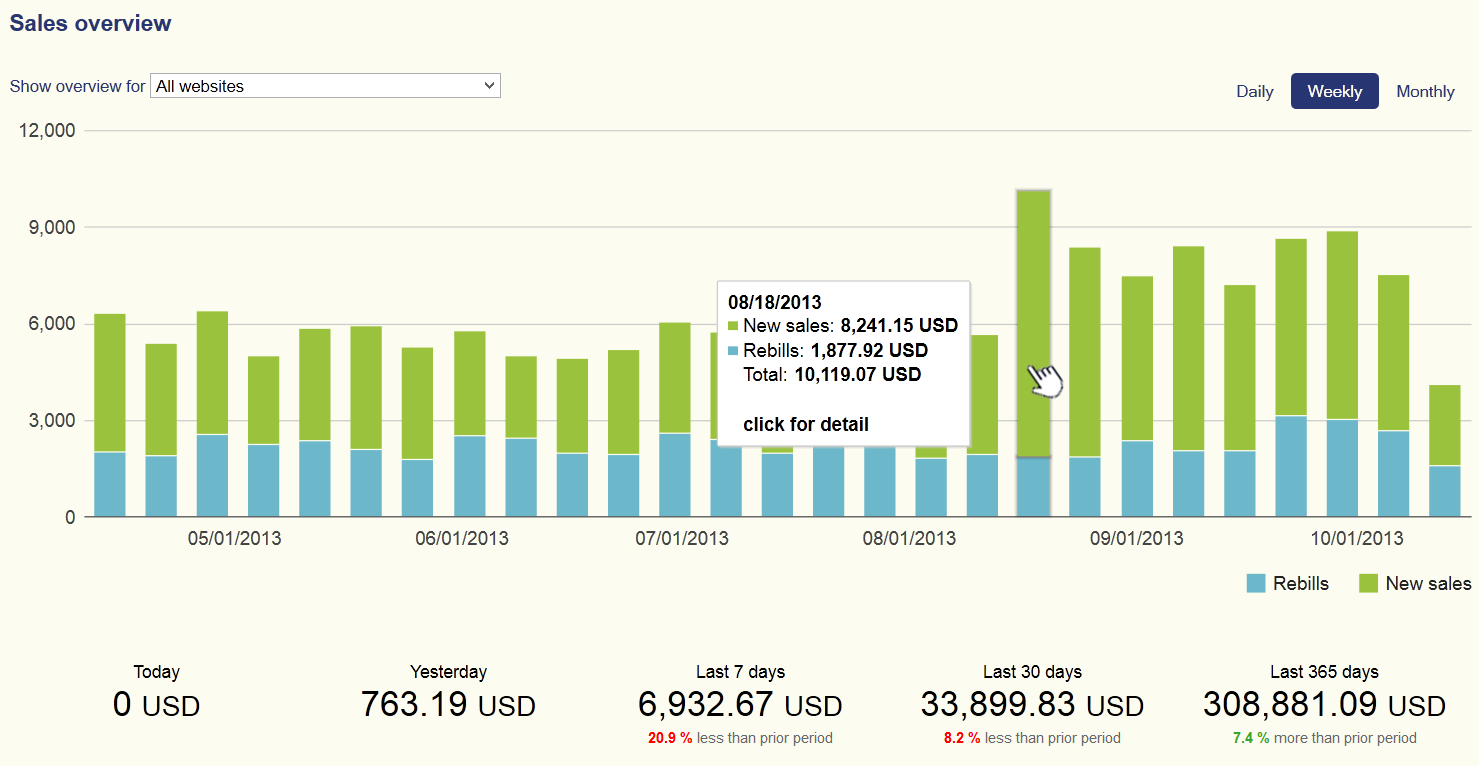
The Sales Overview report now shows a predicted value of sales for the last unfinished period – e.g. week, month.

The Sales Overview report now shows a predicted value of sales for the last unfinished period – e.g. week, month.
 A new PROCESSING ACTIVITY report is now available in the Sales section in the Control Center. In this report you can monitor the transactions and transaction attempts for all your websites. It provides access to buyer and transaction details including transaction result – Approved and Declined. Continue reading
We are pleased to announce that the long ignored Control Center for resellers has been updated. The new design follows the guidelines we have used for merchant’s Control Center. In fact these two are now merged into one, so if you have merchant account and you are reselling websites too, you no longer need to switch between the two.
The Resold Websites tab gives you access to the Commission overview report and there is also the list of resold websites and here you get their banners too.
We will add more features over time based on your feedback.
Update: We have added an option to download the statistical data grouped per website and date, including the number of clicks. The link can be found on the Commission overview page. Continue reading
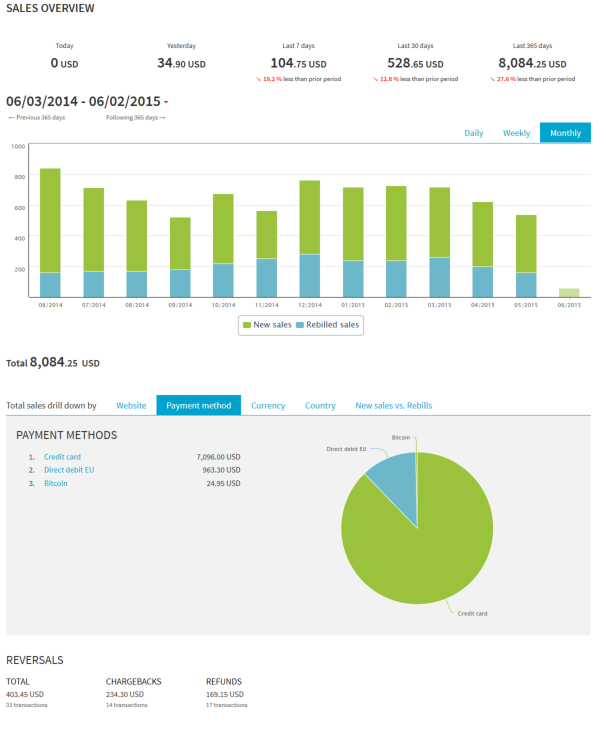
Based on the feedback we have received since introducing the Sales Overview in Control Center we have just released a new redesigned version with additional drill down options.
All Sales Overview information is now available on a single page and can be filtered by website, payment method and sale currency. It is also much easier to select time periods for the report and to navigate along the timeline.
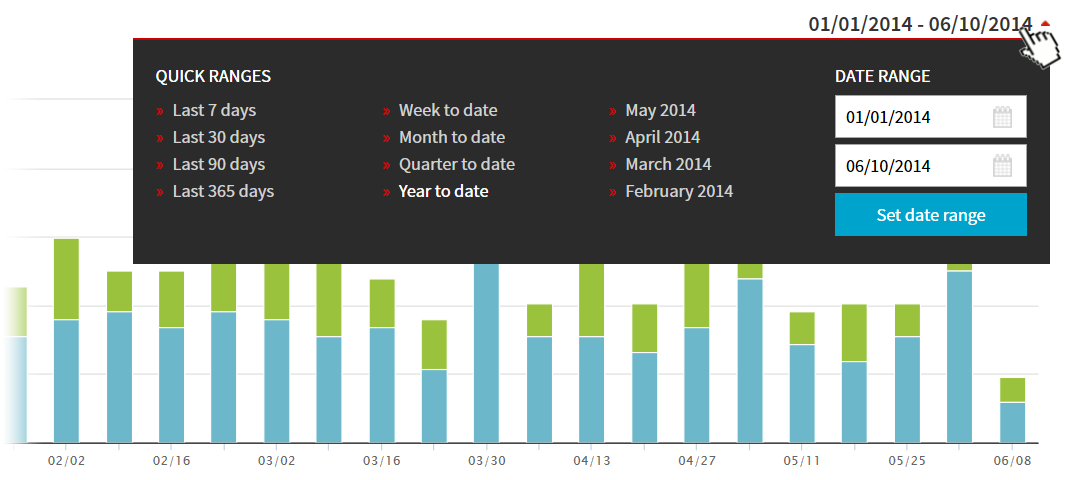
The Sales Overview report has now an option to select custom date periods for which to show the data. In the date range selection dialog you can select preconfigured date periods or a completely custom date range.
There are now several new options to view your sales data.
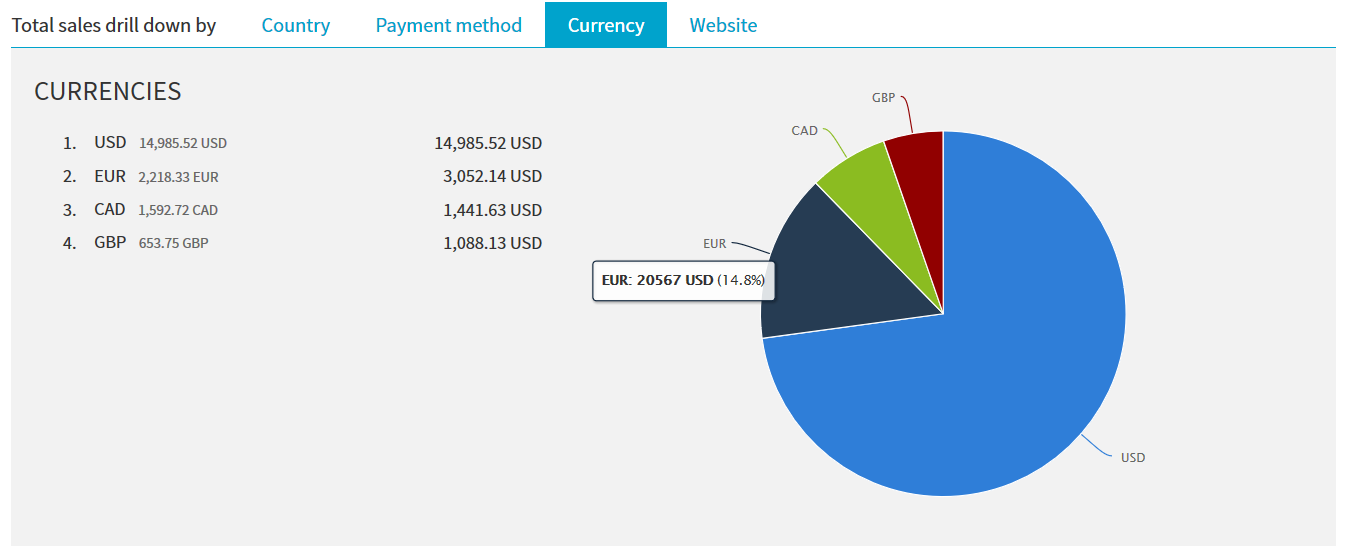
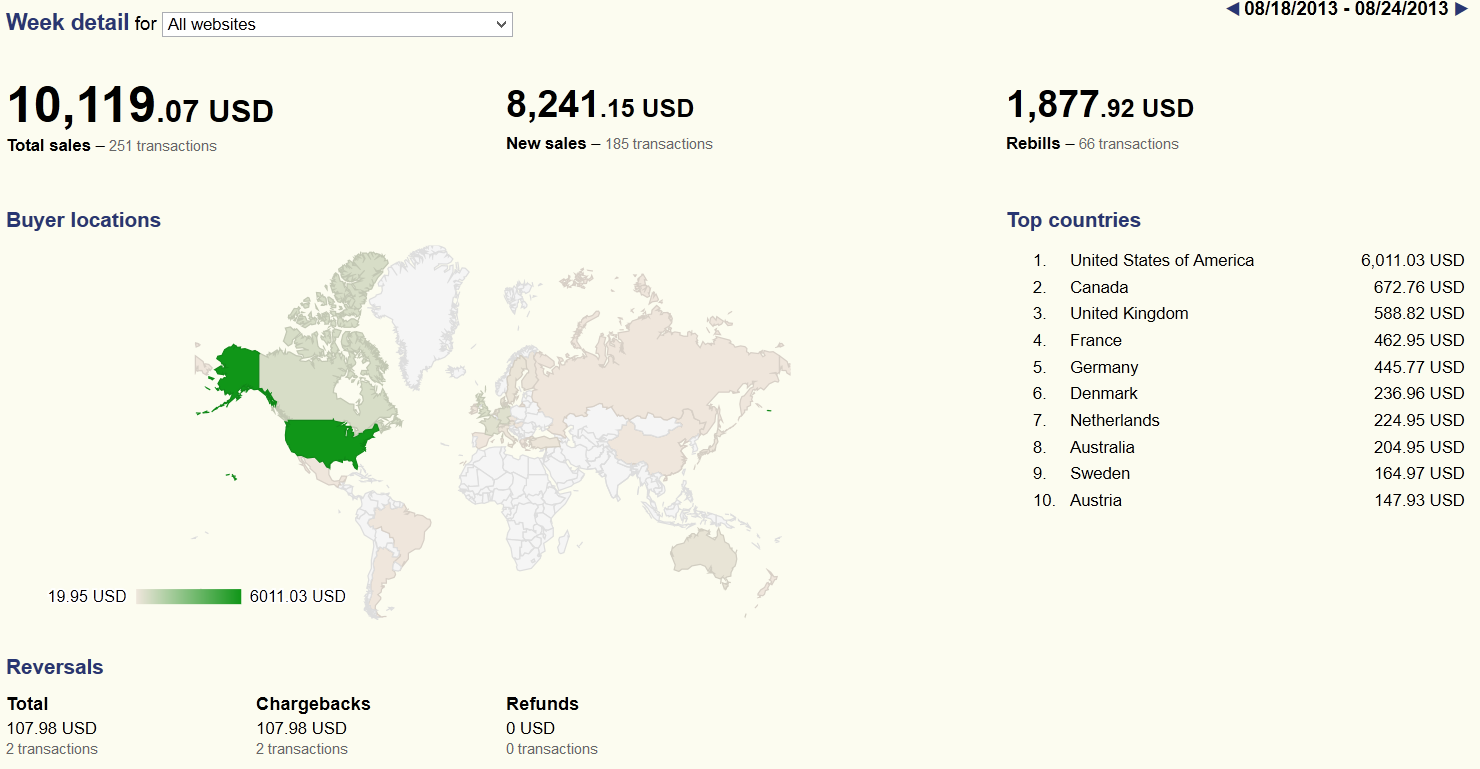
Accessible from the Sales Overview by clicking the chart for selected period you can access the Detail page. In the middle section of the Detail page you can now see more drill-down options – by Payment method, Website and Currency with charts to illustrate the views.
The initial version of the Sales Overview report was released in June. Since then we have received some valuable feedback and some of it is now incorporated in the updated Sales Overview report:
The first page of the report report now gives you:
 By clicking on the chart you can also access the Detail page showing a variety of additional information for the selected period such as:
The middle section of the Detail page now shows the “Top 10 countries” from which your buyers came and a “heat map” showing these countries.
Our vision is to use the middle area for various other reports such as: a list of “Top performing websites” , “Sale breakdown per sale currency”. Are there other reports you want to see here ? Let us know !
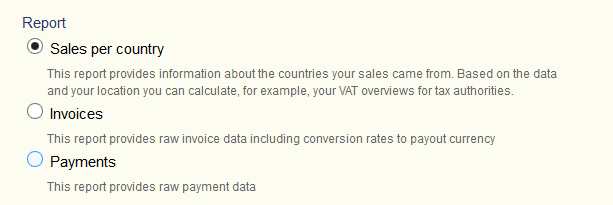
The Financial Reports tool in the Money section of the Control Center extends and replaces the previously released Tax report and now allows you to download data for Sales per country, Invoices and Payments.
The data can be downloaded separately for a selected month or for the whole selected year in both .xls and .csv formats.
Up until now, there was no overview report in the Control Center where you could easily review your processing volumes at a glance. The new Sales Overview report in the Sales section shows all the important information about your sales in a clear tabular and graphical form.
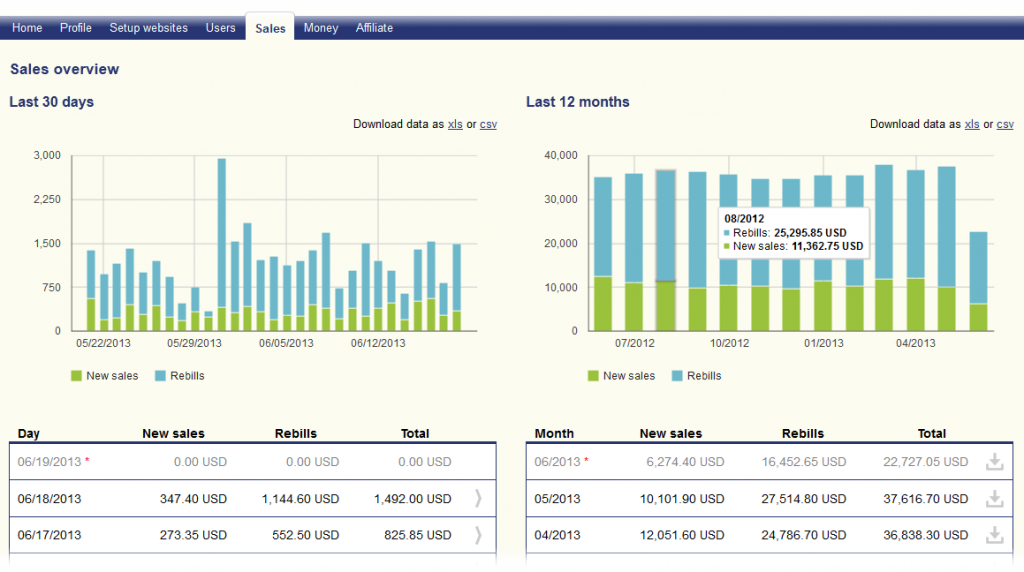 Besides the total processing volumes, information about the split between new sales and rebills is also shown, and the data can also be downloaded.
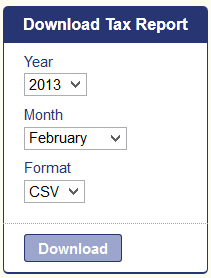 If you need to provide VAT information to the tax authorities, you can now download a report which will help you with the task.
See the new TAX report in the Money section of the Control Center.
Update: The tool was extended and renamed Financial Reports